Detailed Methodology

How we approach inflation-adjusted retirement saving

IMPORTANT INFORMATION

allocatewise.com does not provide investment advice and you should not be engaging in any investment activity without full understanding or a financial advisor. The below is an example of what an inflation optimized portfolio may look like. It does not represent a recommendation or endorsement of any product. In investments and these example portfolios capital is at risk. allocatewise is not responsible for how you use this information. allocatewise is not regulated by the Financial Conduct Authority (FCA) or any other supervisory authorithy.

Detailed Methodology - Challenge - Solution

Saving money to live off later in life ("retirement") is different from general investing. In general investing the benchmark is the riskfree rate paid by governments on their debt. When saving for retirement, the benchmark is the increase in the future cost of living. For simplicity this can be assumed to be inflation - usually expressed as the Consumper Price Index (or CPI). Of course, it is debatable if ones personal consumption costs increase with inflation. But in lack of better alternatives measuring inflation, using CPI or RPI (in the UK) is better than nothing at all. In addition, nobody knows what their future cost of living will be. The best we can do is probably to look at prices for things now.

Looking at retirement savings from inflation focus does not only tend to increase the return that is required to exceed the benchmark. It changes the whole equation!

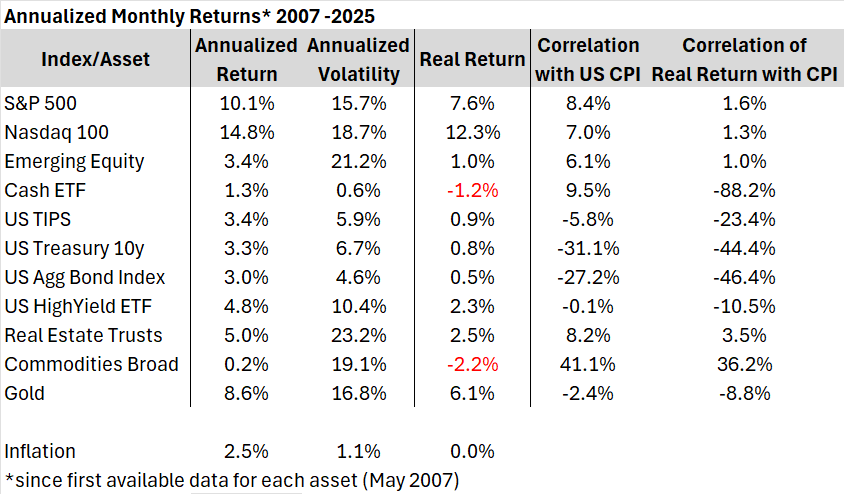
What matters is the performance against the goal of maintaining a good standard of living, as measured by the portfolio's performance against the CPI.
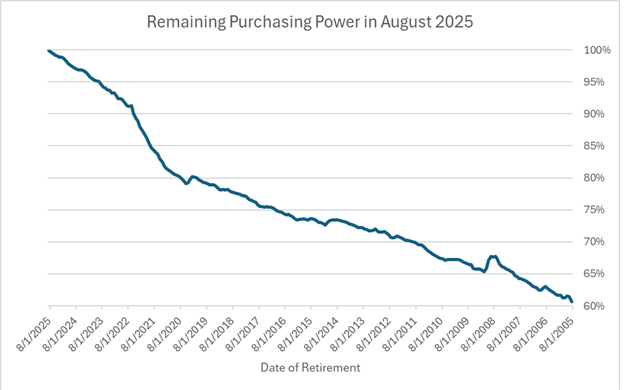
Eroding Purchasing Power

Illustration of how much purchasing power fell from particular points in time. Since 2005 purchasing power of a Dollar fell to 60%

Tale of US Inflation vs. assets

Annualised Monthly returns and volatility for different asset types, along with their real returns and correlation of both Nominal and Real Return with US CPI.

Using inflation as benchmark for retirement savings

In practice, it means that all returns of assets will be measured against inflation.

The table displays the return of these broad ETFs adjusted by the US CPI All Urban Consumer price index. Historical returns are not an indication of the future, but the table demonstrates the potential issue when looking at long term growth rates of portfolios. Without considering the increase in the cost of living, they are not very informative. Furthermore, apart from commodities, no assets exhibit positive correlation with inflation.

Assets moving with inflation

Some assets are traditionally seen as providing some security against inflation. For example Real Estate investments. While they share similar trends with inflation, the direct correlation of Real Estate and inflation is historically relatively small. The same is true for commodities. Assets, which tend to correlate with inflation have historically exhibited poor returns (for example Cash, Commodities).

Picture of correlation matrix

Correlation Matrix of different asset classes vs CPI, for Monthly, Yearly and 5-yearly data

Starting with the real yield

Performance of inflation linked bonds is historically not closely correlated with inflation, nor have they shown significant outperformance against inflation. But they provide a very important function: They define what yield above inflation can be achieved at any given point, by taking only marginal risks. Namely government default and a small reinvestment risk.

Their yield-to-maturity (YTM) above inflation provides a benchmark to measure all other investment opportunities to. The "real" yield.
The UK has continously issued inflation linked bonds with varying maturity. This enables to build a continous real yield curve. In the EUR zone, Germany and France have issued "linkers". For investing in USD there is a well establisehd US TIPS market.

Mapping the real yield of the inflation linked bonds to their maturity dates creates the real yield curve.

Real yield curve example

Real Yield Curve, demonstrating expected real risk-free annualised returns over the next 50 years

Portfolio construction illustration

Inflation linked bond payout strucutre

Establishing a baseline

Historically, the real yield available in the market has varied considerably and often has been negative. The current real yield curve provides the "riskfree" rate in the portfolio construction.

If an investor wants to receive 1,000 GBP in 2040 uplifted by inflation, they can buy the inflation link bond expirying that year and be pretty certain that they will receive the redemption amount in 2040, which incorporates compensation for the inflation experienced in the meantime.

It is important that this is only true if the inflation bond is held to maturity!

Efficient frontier example

The efficient frontier graph

Assessing investments vs. real yield

In efficient markets risk is on average compensated by increased returns. Therefore an investment portfolio should have some risk. But the question is much and in which assets an investor should invest.

Since the introduction of portfolio theory in the 1960s, it is a well known concept to create an "efficient frontier" - meaning the combination of assets which is expected to have the least variation in returns given a specific return. The allocatewise.com App uses this concept based on historical correlation and returns - or user based inputs - to calculate an efficient frontier relative to inflation. The software solves for the minimum variance portfolio given a return and the selection of asset classes, as well as the histoprically observed features of asset classes.

Mixture of 'risk-free' real yield and risky portfolio

The actual allocation in a retirement portfolio should depend on each individuals risk appetite and 'utility function' i.e. how much additional return someone needs to receive in order to take on additional risk.

Each portfolio will always be a combination of "riskfree" i.e. inflation linker - and risky i.e. portfolio based on the asset selection and covariance inputs. How much each individual investor invests into the risky and the riskfree portfolio is guided by their preference and risk tolerance. allocatewise.com only provides indications on which combinations may be attractive to investors. There is some academic guidance around it and you are invited to research according material. For example the Merton Share or the Kelly Criterion .

You may also use the risk slider in our app to get a feel for the sensitivity of allocations to risk appetite.

Graphic to show the concept

Visualization of allocatewise portfolio construction methods using risk-free and risky portfolio mixture