Detailed Methodology
Everything in Allocatewise is measured against one benchmark: the rising cost of living.
Illustrative only, not financial advice · Capital at risk · Important information
Part 1
Why everything is measured against inflation
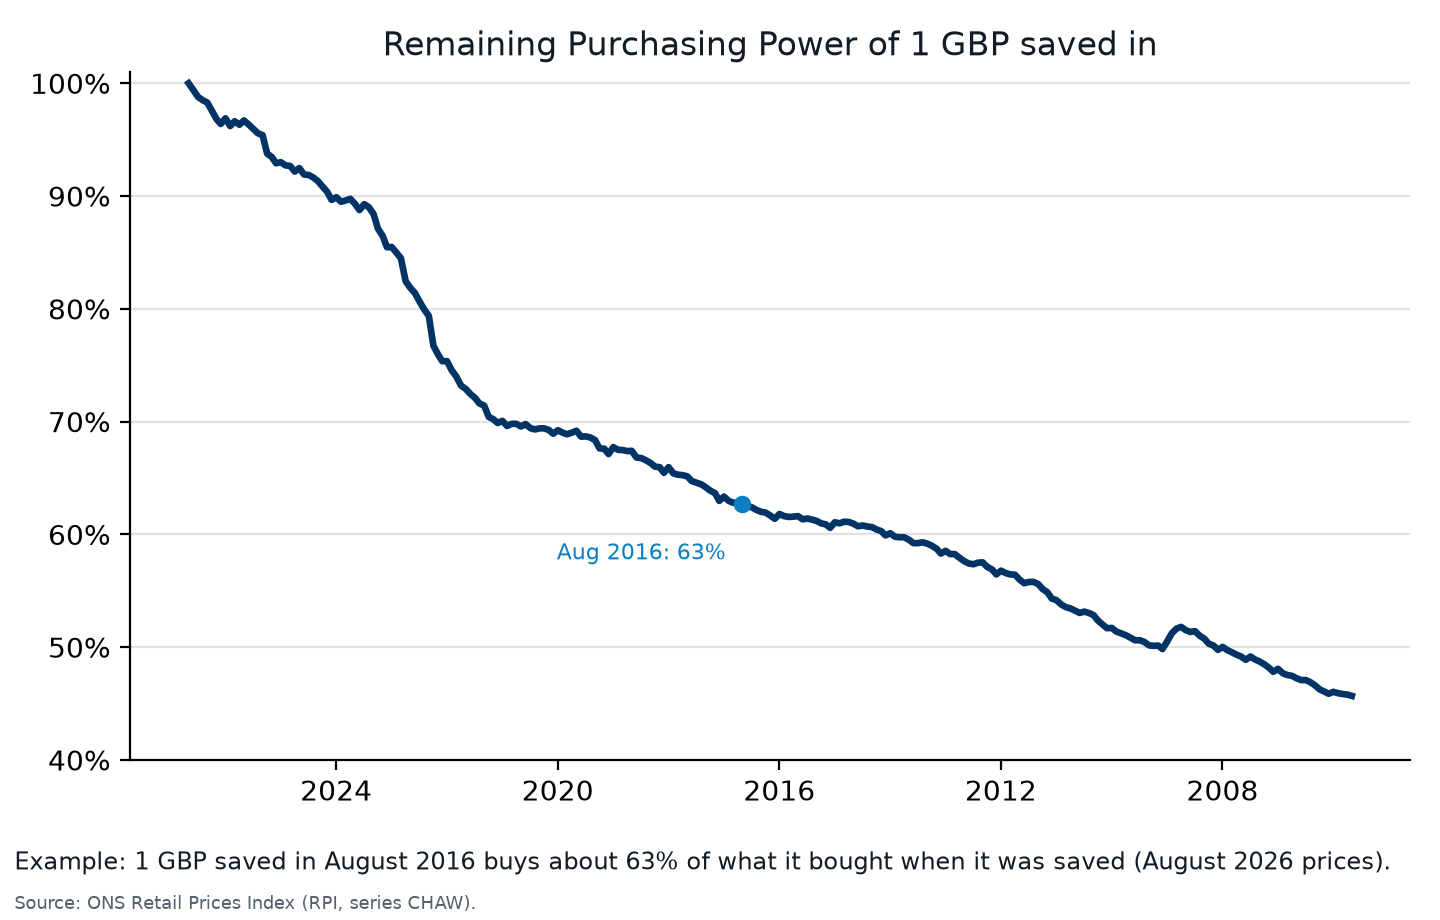
The benchmark is the cost of living
- Retirement savings exist to pay for a way of life, years or decades from now.
- What matters is what the money will buy then, not how many pounds it is.
- So the benchmark is the rise in the cost of living, not a stock market index.
- We use the UK Retail Prices Index (RPI). It is the index UK index-linked gilts follow, which makes it the one an investor can actually hedge.
- Nobody's personal costs rise exactly with RPI, but a published index is a far better yardstick than none.
Nominal returns flatter
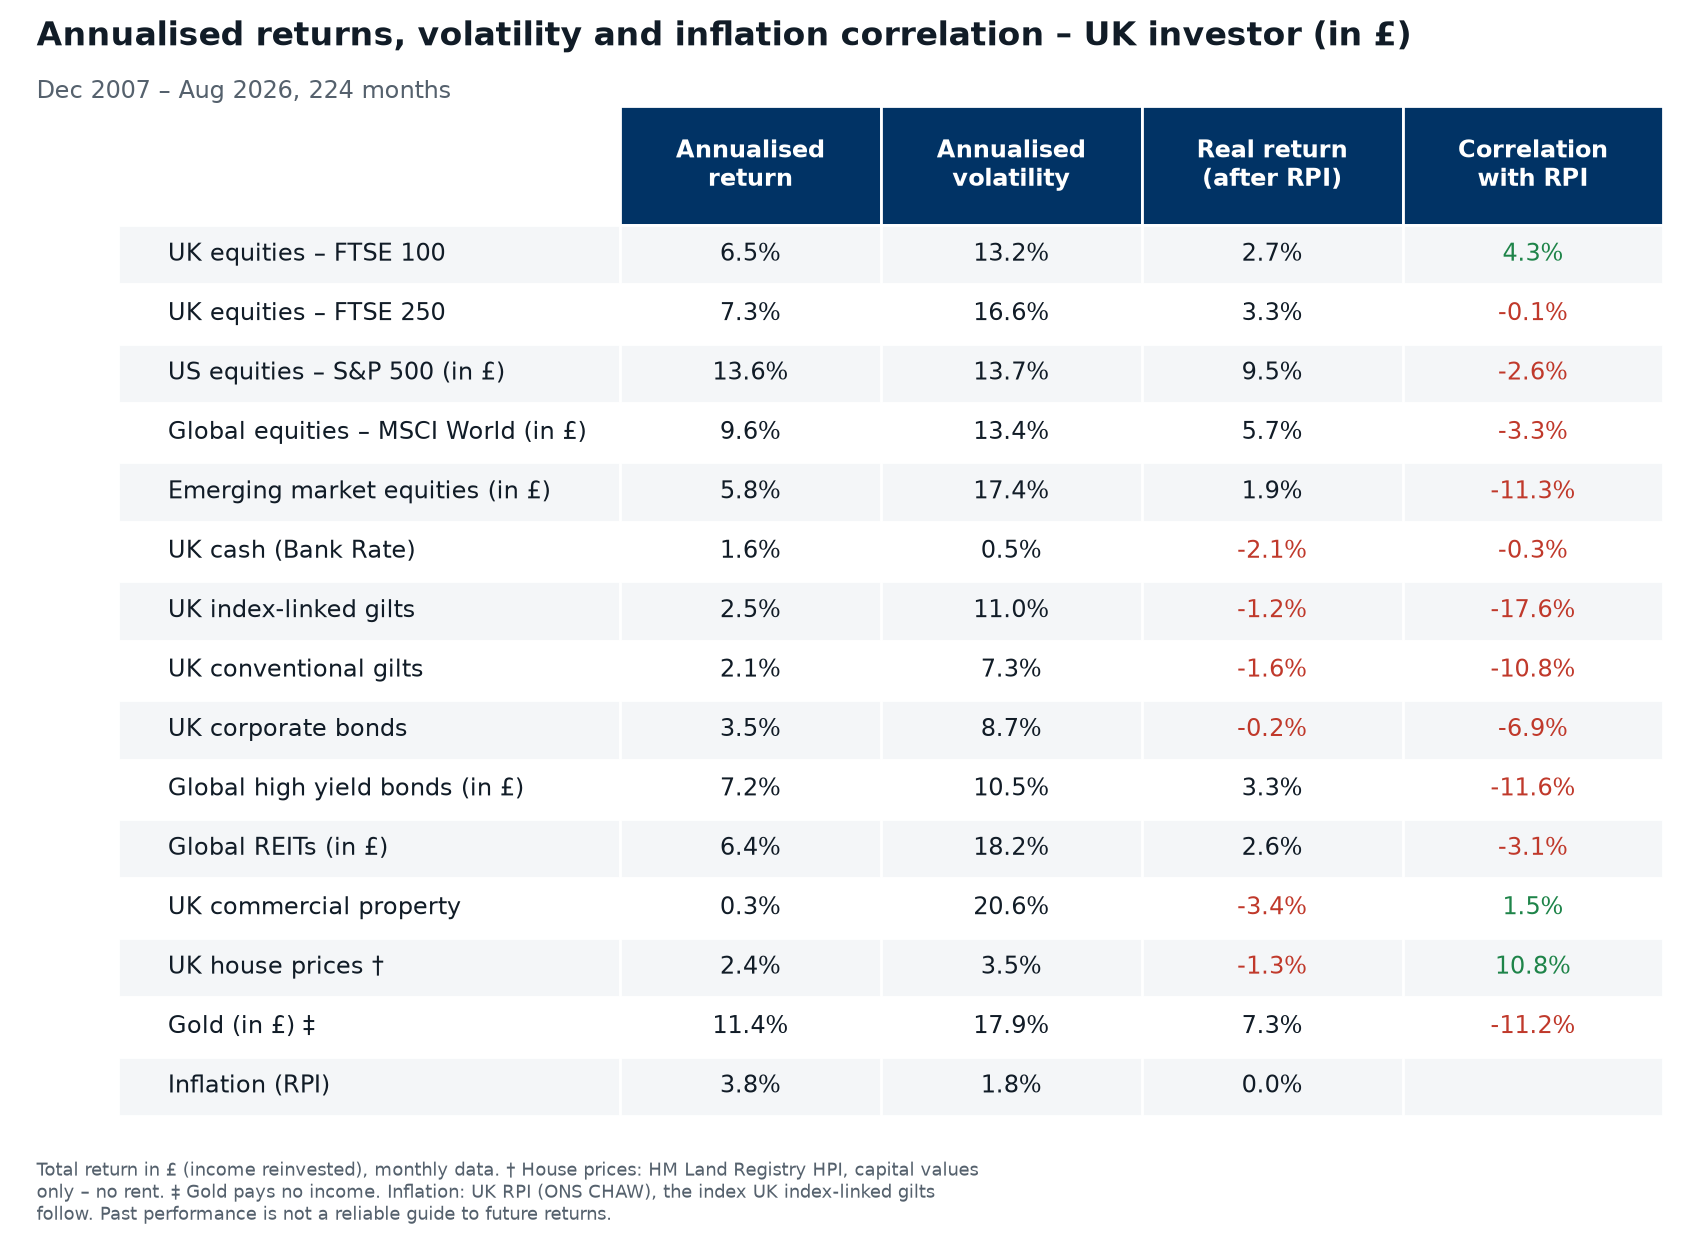
- A return in pounds says little until inflation is taken off.
- Over this period, several asset classes that grew in pounds lost purchasing power once RPI is deducted.
- Cash and gilts, often thought of as "safe", are among them.
- Historical returns are no guide to the future.
- Illustrates the significant difference between nominal and real returns, i.e. before and after inflation.
Few assets move with inflation
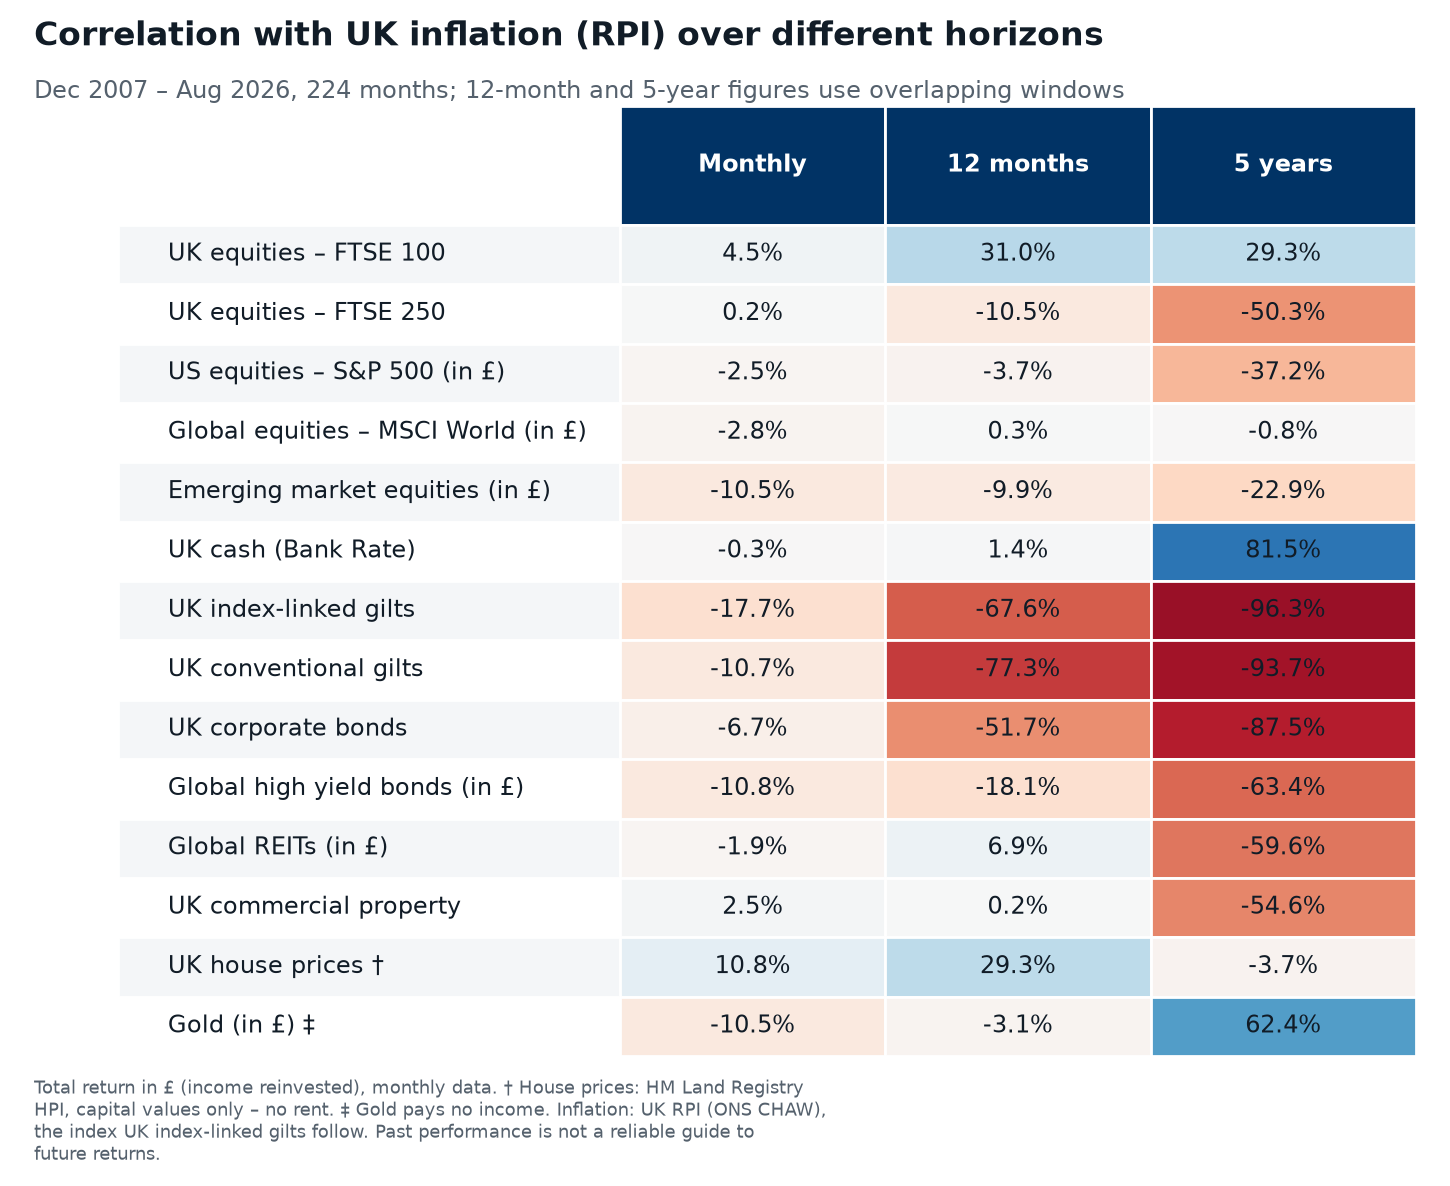
- Some assets are often described as inflation hedges. For example, index-linked (or inflation-linked) bonds or residential property.
- Month to month, almost nothing moves closely with RPI.
- Over longer horizons the picture changes, and not always in the expected direction: when inflation surged, inflation-linked bond prices fell1.
- The longer-horizon figures rest on only a few independent periods, so they are indicative only.
Why are index-linked gilts useful anyway?
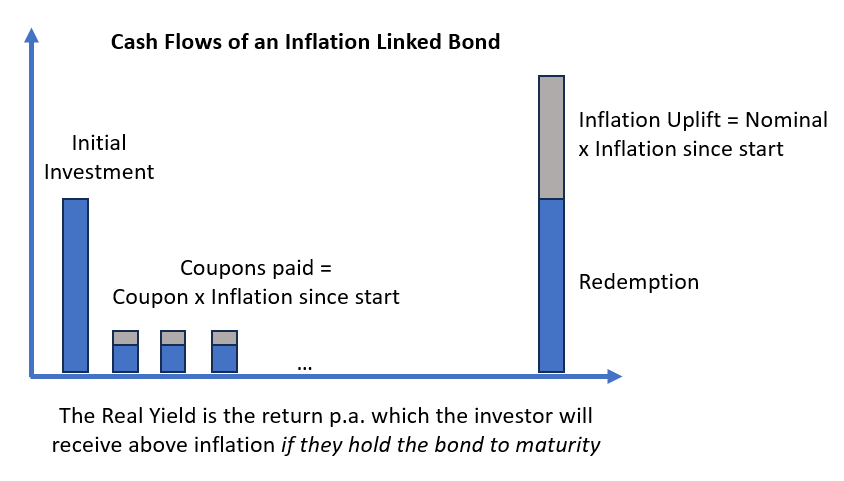
- An index-linked gilt raises its coupons and its repayment in line with inflation.
- Bought today and held until it matures, it pays a known return above inflation: its real yield.
- This real yield can be negative. Between 1985 and 2026, the 10-year real yield ranged from about −3.3% (2021) to +5.0% (1992)
- Sold before maturity, it fetches the market price on the day, which varies with the real yield
- As 2022 showed this market price can be a lot lower than the price paid for it.
Gilts are issued by the UK government, which has never defaulted on a gilt, though that is not a guarantee of future performance. The market price of an index-linked gilt can go up or down, but unless the UK Government defaults it will deliver the promised inflation-linked cashflow at maturity.
The real yield curve sets the baseline
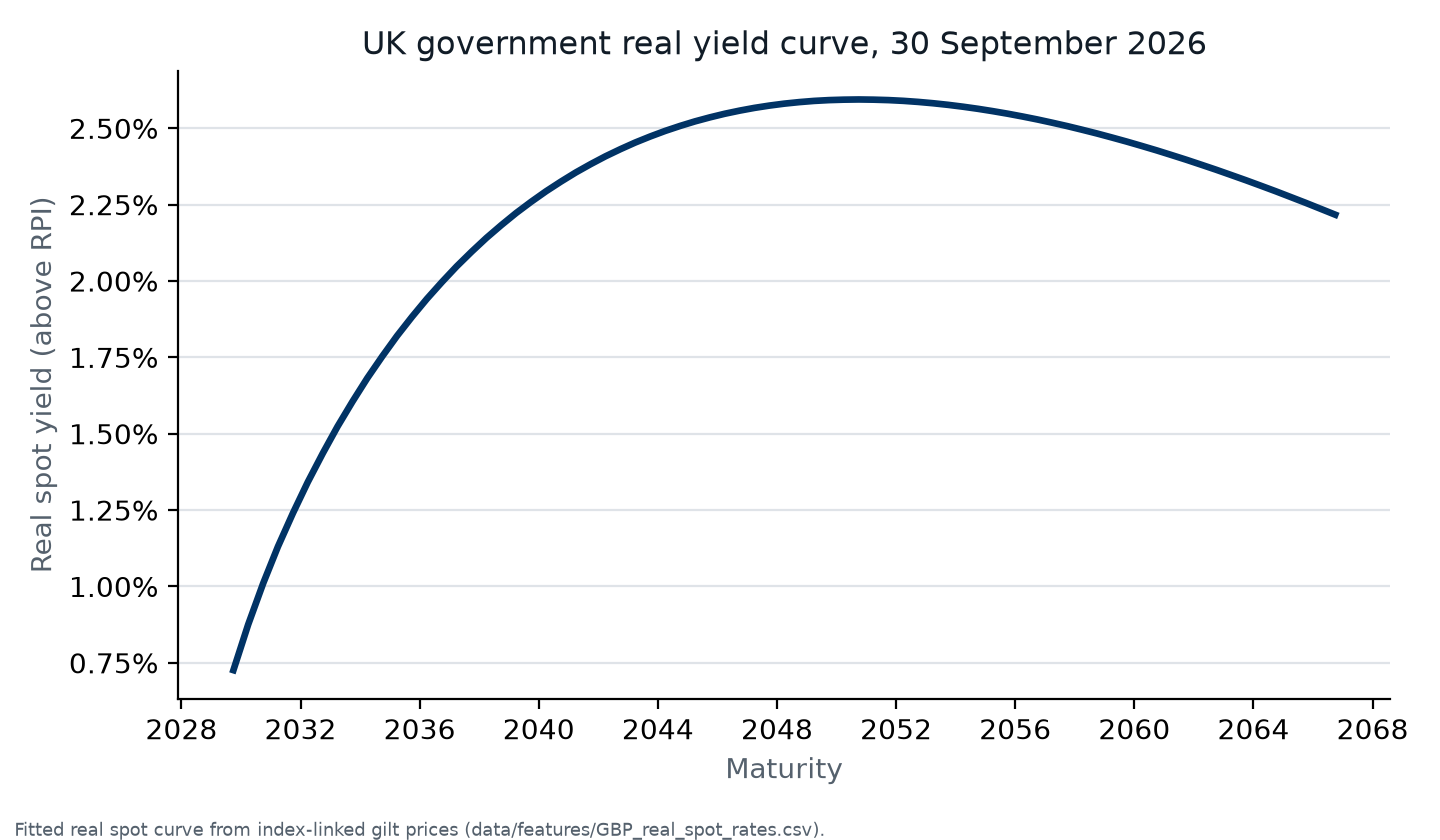
- Plotting each index-linked gilt's real yield against its maturity gives the real yield curve.
- It shows the return above inflation available to investors today
- It works a bit like a term deposit which pays real yield + inflation
- The deposit is with the UK government, which may default. An early withdrawal may have severe penalties. Meaning the price you fetch on any market day for the index-linked gilt will go up and down with the real yield.
- If held to maturity, the index-linked gilt is the investment with the smallest uncertainty relative to inflation at the maturity date.
- Every other investment can be measured against it: does the extra expected return justify the extra risk? Relative to inflation
Part 2
How the projections work – and how they depend on inflation
Your plan as cash flows in today's money
- Your holdings, savings, property and mortgage form the starting point.
- Your plan becomes a list of money in and money out, year by year:
- regular savings until you retire;
- your retirement spending, with the State Pension counted only from the age it is paid;
- major life expenses such as school fees or a home deposit.
- Every amount is entered in today's money. £30,000 a year means £30,000 of today's purchasing power, in every year of the plan.
Many possible futures, not one forecast
- The plan is run through 1,000 simulated futures, month by month, to the end of the plan.
- Markets switch between three regimes, told apart by inflation and interest rates.
- In each regime, asset returns, inflation, and the nominal and real gilt yield curves move together, with the relationships estimated from historical monthly data.
- The simulated yield curves start from today's market implied yield curve.
- If you set the expected inflation to a custom number the simulation will use this number as the long term average inflation.
- The setting of custom inflation goals will impact the simulations returns for index-linked gilts.
Where inflation comes in
- Each future has its own inflation. Inflation is simulated with everything else rather than fixed at one rate, so some futures have inflation shocks and some do not.
- Your spending rises with it. On each path, every planned amount is turned into pounds using that path's own inflation. A high-inflation future needs more pounds to pay for the same plan.
- Assets respond differently.
- Cash earns the simulated short-term interest rate.
- Index-linked gilts held to maturity keep pace with RPI.
- Conventional gilts pay fixed pounds, which buy less when inflation is high.
- Equities and other assets follow the regime they are in.
- The centre of the inflation range is an input. The user can select it to be a specific number or imply it from the current market. Setting custom inflation expectations may impact the relative attractiveness of gilts to index-linked gilts.
- Expected returns are inputs too. By default they start from long-run capital market assumptions. They are illustrative inputs – not a forecast, and not a view on how any asset class will perform. You can change any of them, or switch to long-run historical averages.
Paying for the plan in each future
- Each month's withdrawal is taken from cash first, then from any gilts you hold directly, then from the rest of your investments.
- Your home is sold only as a last resort, and only as a whole.
- Mortgage payments are part of what has to be paid – from your salary until you retire, if you choose, and from your savings after that.
- The portfolio is rebalanced back to its mix every 12 months by default.
What the results show
- The model implied chance of paying for your plan: the share of the 1,000 futures in which every planned withdrawal is paid in full.
- The range of outcomes: the median, with a band from a weak future (10th percentile) to a good one (75th percentile).
- Today's money or future pounds: the same results with or without inflation added back in.
- Any shortfall: the years in which a plan would run short, shown on the cash flow chart.
Tax is not modelled: figures are before income tax and capital gains tax.
Part 3
How the goal-aligned allocation works
Judged by your plan, not by a market index
- The goal-aligned allocation uses the same simulation as your projections.
- It searches across the asset classes you choose for the mix that scores best on the objective you pick.
- Your current mix is simulated on the same 1,000 futures, so the two are compared like for like.
- Under the default objective, if no alternative improves the chance of paying for your plan, your current mix is the one shown.
The objectives you can choose
- Maximise the probability of reaching your goals (the default): the asset mix that pays every planned withdrawal in the highest number of the simulations.
- Reward against risk: the maximum utility† measured by real wealth relative to the risk. Measured against the risk level selected in the model.
- Smoothest ride: the lowest swings in real portfolio value. It does not try to fund your goals.
- Markowitz Sharpe ratio: the classic mean-variance calculation, without simulation. Provided for comparison.
† Utility puts a value on an outcome so that a shortfall counts for more than a gain of the same size. It is measured with a constant relative risk aversion (CRRA) function, U(W) = W1−γ / (1−γ), or ln(W) when γ = 1. W is the real wealth left at the end of the plan, after paying for your goals, in each simulated future. If a future runs out of money, the withdrawals it could not pay are subtracted from W. Below a quarter of your starting wealth, the utility falls away steadily rather than without limit, so larger and less predictable shortfalls count for more. The mix with the highest average utility across the simulations is chosen. γ is the risk aversion set by your answer on risk, from 1 (the boldest, the Kelly criterion) to 5 (the most cautious): the higher γ, the more a shortfall in a bad future outweighs a gain in a good one. ↩
Your appetite for risk
- Your answer on risk sets a single number: how much you value a better outcome against the chance of a worse one.
- It is set using Merton's rule for a long-term investor, which links risk appetite to how much of a portfolio sits in risky assets. The boldest setting corresponds to the Kelly criterion.
- Under the default objective it decides between mixes that fund your plan about equally well.
- A slider lets you change it and see how the allocation responds.
Index-linked gilts as the inflation-relative anchor
- Individual gilts are considered one by one, each with its own maturity, rather than as a single bond index.
- When a plan is well funded, part of the money can first buy index-linked gilts matched to the years of your withdrawals; the rest is then allocated.
- You can also choose to cover particular major life expenses with matched gilts – index-linked for costs that rise with inflation, conventional for fixed amounts.
- This only protects against inflation if each gilt is held to maturity.
Your limits
- You can cap volatility, require a minimum chance of reaching your goals, or limit the chance of a large fall.
- You can set minimum and maximum weights for any asset class, and how often the portfolio is rebalanced.
- The result is an illustration of how the modelled figures change across mixes. It does not say which mix is right for you.
Notes
- 1 Inflation-linked bond prices depend on the real yield: roughly the nominal yield minus the inflation the market expects. If expected inflation and nominal yields rise by the same amount, the price does not change. The most prominent example is 2022: as real yields rose sharply, index-linked gilts lost between a fifth and three-quarters of their value in less than a year – the longer the gilt, the bigger the fall – despite the highest inflation in 40 years. ↩
Capital at risk. The value of investments can fall as well as rise and you may get back less than you invest. Past performance is not a reliable guide to future returns. The figures shown are illustrative examples based on model assumptions and market data; they are provided for general information only and do not constitute financial, investment, tax or legal advice, a personal recommendation, or a financial promotion. The charts, tables and examples on this page illustrate the method; they are not a recommendation to buy, sell or hold any investment, nor an endorsement of any product or asset class. Allocatewise is not authorised or regulated by the Financial Conduct Authority. Figures are shown before tax and do not reflect your personal tax position. If you are unsure whether an investment is right for you, seek advice from a regulated financial adviser. See our full disclaimer.